Measuring Marketing Effectiveness for Startups

Stop staring at spreadsheets hoping for a magic answer. Measuring marketing effectiveness isn't that complicated.
For a bootstrapped startup, it's about one thing: drawing a straight line from every dollar and hour you spend to actual sign-ups and sales. This guide is your playbook to stop guessing and start building a predictable growth engine.
Why Most Startups Get Marketing Measurement Wrong
Let's be blunt. Too many founders chase vanity metrics—like social media likes—that feel good but don't pay the bills. They get paralyzed by a mountain of data or waste money on enterprise-level tools that are total overkill.
This path leads to confusion, wasted cash, and the sinking feeling that marketing is just a cost.
The problem isn't a lack of data; it's the lack of a simple, actionable framework. For a lean startup, smart measurement is about ruthless focus. Know which handful of numbers truly matter. Have the discipline to ignore the rest.
From Actions to Results
At its core, the process is simple: Your marketing actions create data. Analyzing that data shows you the results.
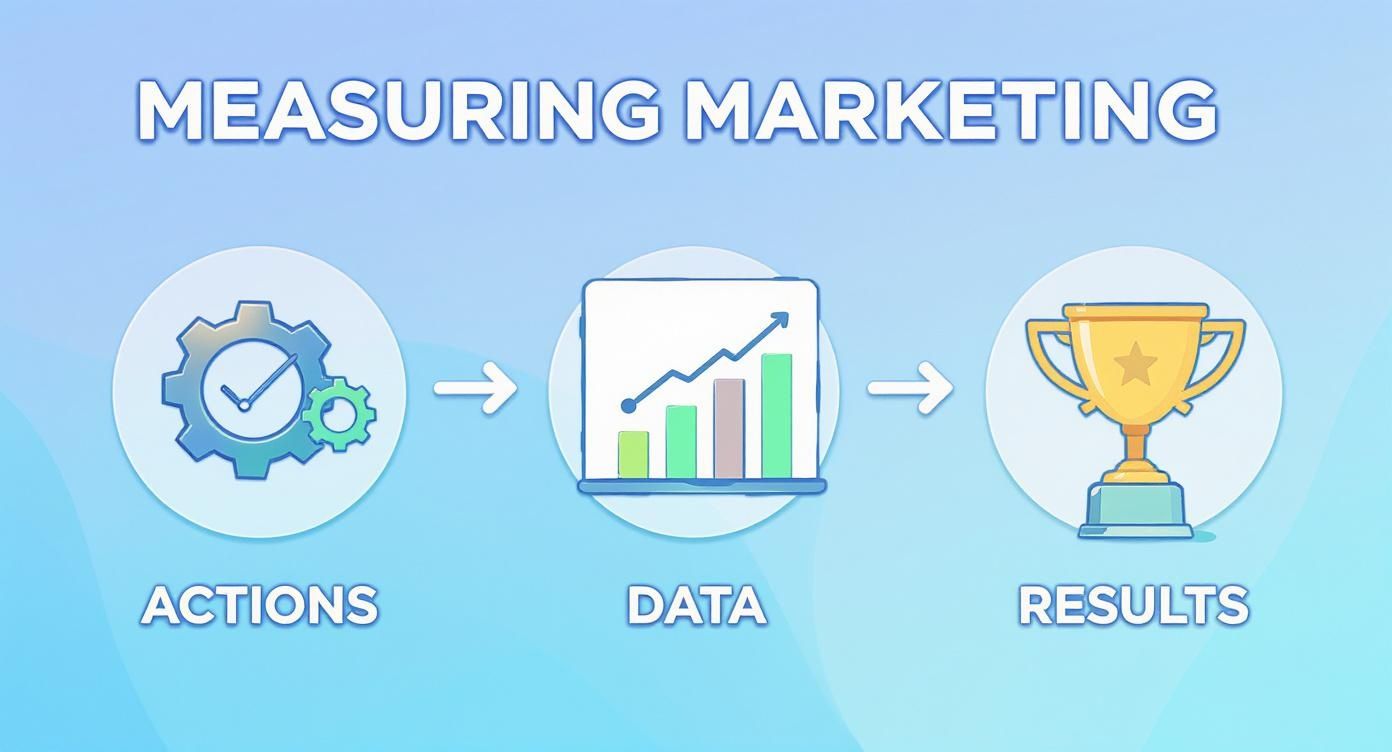
The real insight? Results aren't accidental. They're the direct outcome of a disciplined cycle: do something, then analyze what happened.
It's Time for Smarter Measurement
The pressure is on. Over 61% of marketers are actively trying to improve how they measure their efforts. Gut feelings aren't enough anymore.
Being bootstrapped is your secret weapon. You don't need a massive budget. You need a clear plan to connect your work to real outcomes. It’s the only way to truly understand your marketing ROI and make decisions with confidence.
The goal is to move from hoping your marketing works to knowing exactly how it does. Build a system that gives you clear signals on what to stop, what to continue, and what to double down on.
Ultimately, measuring marketing effectiveness gives you a roadmap to sustainable growth. It ensures every decision is a confident step forward.
Choosing the KPIs That Actually Drive Growth
Stop chasing likes. Forget raw website traffic. These are classic vanity metrics—they look great on a slide but tell you nothing about whether your startup is actually growing.
Real measurement starts by defining what success looks like for your business. That conversation begins with your North Star Metric.
Your North Star Metric (NSM) is the one number that best captures the core value your product delivers. It’s the single metric that, if it goes up, means your entire company is winning. For Airbnb, it’s nights booked. For an e-commerce store, it's weekly first-time orders. This is your anchor.
Once you know your North Star, every other KPI you track must feed directly into it. This is how you build a focused system instead of drowning in useless data.
Ditching Vanity for Actionable KPIs
With your North Star set, pick a small handful of actionable Key Performance Indicators (KPIs) that give you a clear signal on performance. The goal isn't to track everything. It's to track the 3-5 things that matter most.
These KPIs must align with your marketing funnel and your business model.
For a SaaS Startup: You live and die by Monthly Recurring Revenue (MRR), Trial-to-Paid Conversion Rate, and Customer Churn Rate. These fuel long-term growth.
For an E-commerce Brand: Focus on Average Order Value (AOV), Conversion Rate, and Customer Lifetime Value (LTV). These numbers prove you're making profitable sales.
For a Service-Based Business: Track Number of Qualified Leads, Lead-to-Client Conversion Rate, and Cost Per Lead. Your business depends on a steady, cost-effective client pipeline.
Each of these KPIs gives you a clear, actionable insight. Low Trial-to-Paid Conversion? Your onboarding is broken. AOV dropping? Time to test upsells.
Measuring marketing isn’t about collecting data; it's about collecting the right data that forces a decision. If a metric doesn't lead to a clear "what's next?" action, it's a distraction.
From Business Goal to Marketing KPI
To get a clear picture, map your KPIs to each stage of the marketing funnel. This approach helps you instantly spot bottlenecks and see exactly where potential customers drop off. You can't fix a problem you can't see.
This table connects broad business goals to specific, funnel-stage KPIs, making it easy to choose the metrics that truly matter.
Business Goal | Awareness KPI | Consideration KPI | Conversion KPI | Retention KPI |
|---|---|---|---|---|
Increase Revenue | Branded Search Volume | Demo Requests | Customer Acquisition Cost (CAC) | Repeat Purchase Rate |
Boost User Growth | Unique Website Visitors | Free Trial Sign-ups | Sign-up to Paid Conversion Rate | Daily Active Users (DAU) |
Improve Profitability | Organic Traffic from High-Intent Keywords | Add to Carts | Average Order Value (AOV) | Customer Lifetime Value (LTV) |
Build a Community | Social Media Reach & Engagement | Newsletter Subscribers | User-Generated Content Submissions | Community Engagement Rate |
Organizing your metrics this way helps you diagnose issues fast. High awareness (tons of traffic) but low consideration (few trial sign-ups)? Your landing page or offer has a problem.
Ultimately, all conversion KPIs roll up into one of the most critical metrics for any bootstrapped startup: Customer Acquisition Cost (CAC). Knowing how much it costs to win a new customer is fundamental to survival.
To master this number, check out our guide on customer acquisition cost calculation. This metric, when compared to your Customer Lifetime Value (LTV), tells you the most important story: whether your business model is actually viable.
Focusing on these core KPIs moves you from hoping your marketing works to knowing precisely how—and where—it’s driving real growth.
So, you've got your KPIs. Now what? How do you connect a blog post, an ad, or an email to a paying customer?
This is attribution. It sounds complex, but you don't need fancy software to figure out what's working, especially when you're bootstrapping.
The idea is to follow the breadcrumbs. Create a clean data trail that shows which marketing efforts bring in cash. This lets you double down on what works and kill what doesn't.
Start with Simple Last-Touch Attribution
For a lean startup, the quickest win is Last-Touch Attribution. It’s dead simple: it gives 100% of the credit for a sale to the very last thing a customer clicked before they bought.
Did they click a Google Ad right before signing up? The ad gets all the credit.
Sure, it's not perfect. It ignores every other touchpoint that built awareness. But it delivers immediate, clear, and actionable data. Most tools, like Google Analytics, use this by default, so it's incredibly easy to start. You'll instantly see which channels are your "closers."
While it's a practical start, know its limits. Eventually, you might explore more sophisticated Multi-Touch Attribution Models. For now, last-touch delivers the clarity you need to make fast, informed decisions.
Master the Art of UTM Parameters
Your most powerful tool for measuring marketing on a budget is the UTM parameter. These are just text snippets you add to a URL to see exactly where your traffic comes from. They tell your analytics which source, campaign, and even which specific ad led to a click.
Think of them as digital fingerprints.
Without them, all your traffic gets lumped into vague buckets. You won't know if it was that one LinkedIn post or your weekly email that drove ten new sign-ups.
A UTM-tagged URL looks like this: yourwebsite.com?utm_source=linkedin&utm_medium=social&utm_campaign=q4_launch
Here's the must-have breakdown:
utm_source: The platform, like
google,linkedin, ornewsletter.utm_medium: The channel, such as
cpc,social, oremail.utm_campaign: The specific effort, like
q4_launchorebook_promo.
To make this foolproof, use Google's free Campaign URL Builder. Just plug in the values, and it spits out the tagged URL.
By consistently tagging every link, you create a pristine dataset that gives you undeniable proof of what's performing.
Be ruthless with your UTM naming. Seriously. Decide on a format (e.g., all lowercase, using underscores) and stick to it. Mixing
Don't Forget Qualitative Data
Hard data is your bread and butter, but don't ignore the power of just asking people.
One of the most effective, low-tech attribution methods is adding one optional field to your sign-up form: "How did you hear about us?"
The answers are pure gold.
You'll uncover channels that are impossible to track digitally—word-of-mouth, podcast mentions, or that one Slack community you didn't know existed. This qualitative feedback fills the gaps your analytics can't see.
It's also a great way to sanity-check your quantitative data. If analytics show social media is your top channel, but dozens of customers write "heard you on the Startup Success podcast," you’ve just found a hidden growth engine. It's that simple.
Running Smart Experiments to Find What Works
Great marketers don't trust their gut—they test everything. You have your KPIs and you understand attribution, but that only tells you what has happened. Smart experiments show you what will happen, turning your marketing from a guessing game into a predictable growth machine.
Forget debating button colors. Run simple, meaningful tests on what moves the needle—your ads, landing pages, and email sequences. This is how you stop guessing and start building a playbook of proven winners.
This approach replaces opinions with data. Instead of asking, "Do we think this ad will work?" you ask, "What can we test to prove this ad works?" It’s a fundamental shift and a core part of truly measuring marketing effectiveness.
Form a Strong Hypothesis
Every good experiment starts with a clear, testable hypothesis. A weak one is a vague guess like, "Let's try a new ad." A strong one is specific, measurable, and tied to a business outcome.
Use this simple structure: "If we [change X], then [outcome Y] will happen, because [reason Z]."
This framework forces you to justify the why of your test before you start. It connects an action to a result and demands logic.
Practical examples for a bootstrapped startup:
For a Landing Page: "If we change our headline from feature-focused ('Our AI-Powered Tool') to benefit-focused ('Cut Your Reporting Time in Half'), we will increase free trial sign-ups by 20% because prospects care more about solving their pain than our tech."
For a Facebook Ad: "If we swap our static product image for a 15-second user testimonial video, we will decrease our Cost Per Lead by 30% because social proof builds trust faster."
For an Email Campaign: "If we change our subject line from a generic announcement ('Our New Update is Here') to a curiosity-driven question ('Did we just make your job easier?'), we will improve our open rate from 25% to 40% because it sparks intrigue."
See how each one includes a specific metric and a target? That’s how you define a "win" before spending a dime.
Establish a Control and Isolate Your Variable
To know if your change worked, you need a baseline. This is your control—the original, unchanged version.
The new version is the variant. The golden rule is to change only one significant thing at a time.
If you change the headline, image, and call-to-action all at once, you’ll have no clue which element caused the lift (or drop) in conversions. You learned nothing.
Isolate your variable. Get a clean result. Test the headline. If it wins, it becomes the new control for your next experiment on the call-to-action. This iterative process stacks up compounding gains over time.
Pro Tip: Let your experiments run long enough to reach statistical significance. For a low-traffic startup, this might mean weeks, not days. Don't jump to conclusions based on a handful of conversions.
Document Everything You Learn
Winning experiments feel great, but failed experiments are where the real learning is. A test that tanks isn't a failure—it's a valuable insight into what your audience doesn't want. That knowledge is crucial for measuring marketing effectiveness.
But insights are useless if they're forgotten. Create a simple spreadsheet or a shared doc to track every experiment.
Your log should include:
Hypothesis: What you tested and why.
Control & Variant: A clear description or screenshot of both.
Key Metric: The single KPI defining success (e.g., Conversion Rate, CTR).
Results: The raw numbers and percentage change.
Conclusion & Next Steps: A one-sentence summary of what you learned and what's next.
This simple log becomes your startup's marketing brain. It stops you from repeating failed tests and ensures every marketing dollar makes your strategy smarter. This disciplined loop of testing, measuring, and learning is the fastest way to find what truly works.
Building Your Lean Marketing Dashboard
All that data you collected is worthless sitting in a spreadsheet. Turn those numbers into an at-a-glance decision-making tool. That's your lean marketing dashboard.
This isn't some complex analytics hub. It's one clean page that tells you the story of your marketing performance in seconds. The goal is clarity, not complexity.
A good dashboard cuts through the noise and puts your most critical metrics front and center. Think of it as the cockpit of your marketing engine—it shows you where you're headed and when to change course.
Choosing Your Dashboard Tool
You don't need an expensive subscription. Today's free tools are more than powerful enough for a bootstrapped startup.
Google Looker Studio (formerly Data Studio) is the undisputed champion. It's free, connects seamlessly with Google Analytics and Google Sheets, and is incredibly flexible. You can pull in data from multiple sources and create custom charts that update automatically.
Here’s what a clean layout in Google Looker Studio can look like.
The key is to visualize data in a way that instantly highlights trends, like week-over-week user growth or a sudden spike in a channel's performance.
When you're first setting up, check out some top business intelligence dashboard examples for inspiration. Seeing how others present data can spark ideas for keeping your own dashboard clean and focused.
What to Include and What to Cut
The power of a lean dashboard lies in what you leave out. Clutter is the enemy. Your dashboard should be a ruthless edit of only your most important metrics.
Must-Haves for Your Dashboard:
Your North Star Metric: Put this number at the very top, big and bold. It’s your ultimate measure of success.
Your 3-5 Key KPIs: Display your core KPIs (CAC, LTV, Trial-to-Paid Conversion Rate). Show the current number and the 30-day trend.
Funnel Conversion Rates: A simple visualization of your marketing funnel with conversion rates at each stage will instantly show your biggest leaks.
Top Performing Channels: A simple bar chart showing which channels (Organic Search, Google Ads, etc.) are driving the most conversions or leads is a must.
This focus prevents "data paralysis"—that feeling of being overwhelmed that plagues so many teams. In fact, poorly integrated data has cost 55% of US marketers revenue, while 34% of CMOs admit they don't trust their data. A clean, trusted dashboard is your first line of defense.
If you want a head start, our pre-built Dashfolio marketing dashboard templates are designed for this lean approach.
Establish a Practical Reporting Rhythm
A dashboard is only useful if you look at it. Establish a clear rhythm for reviewing your data to spot trends, fix problems, and seize opportunities.
A simple, effective cadence:
Daily Check (2 minutes): Glance at ad spend and conversions. The goal is to spot major fires, like an ad campaign burning cash for no reason.
Weekly Review (15 minutes): Dig into channel performance and funnel metrics. Are you on track? Any winning experiments to scale up? This is your tactical check-in.
Monthly Strategy Session (60 minutes): Zoom out. Analyze your North Star Metric trend, CAC, and LTV. Use these insights to set priorities and plan next month's experiments.
This rhythm turns data review from a dreaded chore into a powerful habit that drives consistent growth. It’s how you make sure your marketing is always getting smarter.
Your Questions on Marketing Measurement Answered
Even with a solid playbook, measuring marketing effectiveness can feel like flying blind. Bootstrapped startups hit the same walls and ask the same questions. Let's clear the air with direct answers to the most common roadblocks.
This isn't theory. These are practical fixes you can implement today to make smarter, data-backed decisions.
Think of this as your go-to reference. When you're stuck, come back here. The goal is to spend less time wondering and more time executing on what moves the needle.
How Do I Measure Brand Awareness Channels
It’s the classic dilemma: how do you measure something as fuzzy as "brand awareness" without a massive budget? Stop trying to measure it directly. Get smart with proxy metrics.
These numbers signal your brand-building efforts are working, even without a straight line to revenue. You're looking for proof that more people are seeking you out by name.
Here are the top three proxy metrics to watch:
Direct Traffic: This is gold. People are typing your URL straight into their browser. A steady increase means more people remember your brand name.
Branded Search Volume: Open Google Search Console and see how many people are searching specifically for your company name. An upward trend is undeniable proof your brand is gaining mindshare.
Social Media Engagement: Look beyond likes. Track shares, comments, and brand mentions. These actions show your content is resonating enough for people to spread the word.
While these don't scream immediate ROI, consistent growth here is a powerful leading indicator of what’s to come.
Don't dismiss brand building because it's hard to track. It's the trust battery that makes your direct-response marketing—like ads and emails—work better. A strong brand lowers your customer acquisition costs in the long run.
What Is the Most Important Metric
Gun to your head, you can only track one thing. What is it? For any bootstrapped startup, it's the relationship between two numbers: Customer Acquisition Cost (CAC) and Customer Lifetime Value (LTV).
This isn't just a metric; it's the raw math of your business model's survival.
Customer Acquisition Cost (CAC): Total sales and marketing spend divided by new customers acquired. This is exactly how much it costs to win one customer.
Customer Lifetime Value (LTV): The total revenue you can expect from one customer over their entire relationship with you.
The magic is the LTV to CAC ratio. A healthy business should aim for an LTV that's at least 3x its CAC. For every dollar you spend to get a customer, you should get three dollars back. This simple ratio tells you if you have a real business or a leaky bucket.
How Often Should I Review My Marketing Metrics
Staring at your dashboard all day creates anxiety, not insight. But checking out for a month means you could be burning cash on a broken campaign. The key is to set a rhythm based on the type of metric.
Think in terms of leading versus lagging indicators.
Leading Indicators (Daily/Weekly Check): These are your real-time, tactical metrics that signal immediate performance. Think ad clicks, campaign spend, and landing page conversions. A quick daily or weekly glance is all you need to spot fires.
Lagging Indicators (Monthly/Quarterly Review): These are the big-picture, strategic metrics showing the overall health of your growth engine. Dig into CAC, overall ROI, and LTV. A monthly or quarterly review is perfect for evaluating strategy and planning big moves.
This cadence gives you the best of both worlds. You stay on top of the day-to-day without getting lost in the noise, freeing you up to focus on the long-term trends that actually drive growth.
Ready to stop guessing and start growing with a proven marketing playbook? The Viral Marketing Lab offers a complete suite of tools, templates, and expert-led guides designed for bootstrapped founders. Get the actionable resources you need to build a predictable growth engine today at https://viralmarketinglab.com.


