How to Measure Marketing ROI and Prove Your Value

Want a bigger marketing budget? Stop talking about clicks and impressions. Start talking about profit.
That’s where Marketing ROI comes in. It's the one metric that cuts through the noise and answers the only question your CEO really cares about: "For every dollar we spend, how many are you bringing back?"
This guide is your playbook. We'll show you how to turn your marketing from a "cost center" into a proven profit driver. From "I think this is working" to "I can prove this generates an X% return." This is how you get a seat at the strategy table and secure the resources to win.

The Pressure Cooker Is On
The demand for accountability is real and growing. A recent study revealed that a staggering 83% of marketing leaders now consider proving ROI their top priority—a huge jump from just 68% five years ago.
But here’s the kicker: only 36% feel they can actually measure it accurately.
That gap is your opportunity. The marketers who close it will lead teams, get projects green-lit, and build bulletproof careers. Knowing how to calculate marketing ROI isn't just a good skill—it's a requirement.
Getting the ROI Formula Right
The basic ROI formula looks simple:
(Revenue from Marketing – Marketing Cost) / Marketing Cost
The real trick is nailing the "Revenue" and "Cost" inputs. Get this wrong, and your entire calculation is garbage.
Gain from Investment (Revenue): This isn't just the final sale. It's the total value you can trace back to marketing. For e-commerce, it’s direct sales. For B2B, it’s the lifetime value of every lead generated.
Cost of Investment: This is everything. Everything. Ad spend, yes, but also software, agency fees, and the portion of your team's salaries dedicated to the project.
Key Takeaway: Only counting ad spend gives you a vanity metric. A defensible ROI accounts for all costs. Honesty in your numbers builds trust.
For startups, this isn't an exercise; it's a survival mechanism. A crystal-clear view of ROI is the core of any effective startup marketing strategy. It tells you what to scale and what to kill—fast—before you burn through cash.
Accounting for Every Dollar in Your Marketing Spend
Accurate ROI isn't about fancy math. It's about honest accounting.
Your final number lives or dies by how brutally honest you are with your inputs. This is where you go granular and move way beyond the obvious.
If you only count ad spend, you're not measuring real ROI—you're creating a vanity metric for a slide deck. To get a bulletproof number that fuels smart decisions, you must account for every single dollar.
Uncovering Your True Marketing Investment
Your total marketing cost is more than the line item on your Google Ads invoice. It’s a mix of direct, indirect, and forgotten expenses. Getting this wrong is the single most common mistake—and it leads to inflated ROI figures and bad strategy.
Let's break down what really belongs in your "Marketing Cost" bucket.
Direct Campaign Costs These are the easy ones. The numbers you see on invoices.
Ad Spend: Cash paid directly to platforms like Google, Meta, LinkedIn, or TikTok.
Agency & Freelancer Fees: Retainers or project fees for external partners.
Creative Production: Costs for video, design, copywriting, or any assets created.
Overhead and People Costs This is where most marketers stop, but these costs are real and significant. A portion of your team's time and tools must be factored in.
Team Salaries: Calculate the percentage of time your team spends on a campaign and allocate that slice of their salaries.
Software & Tool Subscriptions: Don't forget your CRM, analytics platforms like Ahrefs or Semrush, and social media schedulers.
Training & Development: Did your team take a course for this campaign? That’s a cost.
To get a realistic cost for a campaign that took one marketer two weeks, you wouldn't just count ad spend. You'd add 50% of their monthly salary and 50% of their software's monthly cost. That's your true investment.
Assigning a Value to Your Marketing Gain
Just like costs, the full value of your return can be hidden. A direct sale is easy to count, but not all wins are that obvious. Knowing how to measure marketing ROI means assigning credible financial value to different results.
For an e-commerce flash sale, the "Gain" is simple: total sales. But what about a B2B lead-gen campaign? That's a different beast.
Here’s how to think about it:
Direct Revenue: The most straightforward gain—sales directly tied to your marketing via tracking codes.
Customer Lifetime Value (CLV): This is the game-changer. Don't just count the first purchase. A great campaign creates a customer. Calculate the average total revenue a new customer brings in over their entire relationship.
Lead Value: For B2B or long sales cycles, assign a value to new leads. A common method: multiply new leads by your conversion rate and average CLV. The formula: (Leads x Conversion Rate x Average CLV = Total Lead Value).
Real-World Scenario Breakdown
Let’s put this all together with two different campaigns.
Scenario 1: E-commerce Flash Sale
Goal: Drive immediate sales.
Costs: $5,000 in Facebook ads + $1,500 for a freelance designer + 25% of a marketing manager's monthly salary ($1,250).
Total Cost = $7,750.
Gain: The campaign generated $25,000 in direct sales.
Total Gain = $25,000.
ROI: (($25,000 - $7,750) / $7,750) = 222%
Scenario 2: B2B Content Campaign
Goal: Generate qualified leads.
Costs: $3,000 for a whitepaper writer + $1,000 in LinkedIn ads + 50% of a content marketer's salary ($2,500).
Total Cost = $6,500.
Gain: The campaign generated 50 qualified leads. The company knows 10% of leads become customers, and the average CLV is $15,000.
Total Lead Value: 50 leads * 0.10 conversion rate * $15,000 CLV = $75,000.
ROI: (($75,000 - $6,500) / $6,500) = 1053%
This detailed accounting prevents you from killing a high-value B2B campaign just because it doesn't bring in immediate cash. For startups, this isn't just good practice—it's essential. Find more powerful strategies in our guide on growth hacking for startups to maximize impact on a tight budget.
Choosing an Attribution Model That Makes Sense
A customer clicks a social ad, sees a display banner a week later, and finally buys through a search ad. Who gets the credit? This is the central puzzle of marketing attribution. Nailing it is critical for your real marketing ROI.
Your choice of attribution model isn't just a technical setting. It's the lens through which you see your entire customer journey.
Pick the wrong one, and you’ll kill a high-performing awareness campaign while pouring money into channels that only close deals someone else started. The goal is a model that reflects how your customers actually buy.
This is a simplified way to start tracking your core numbers.
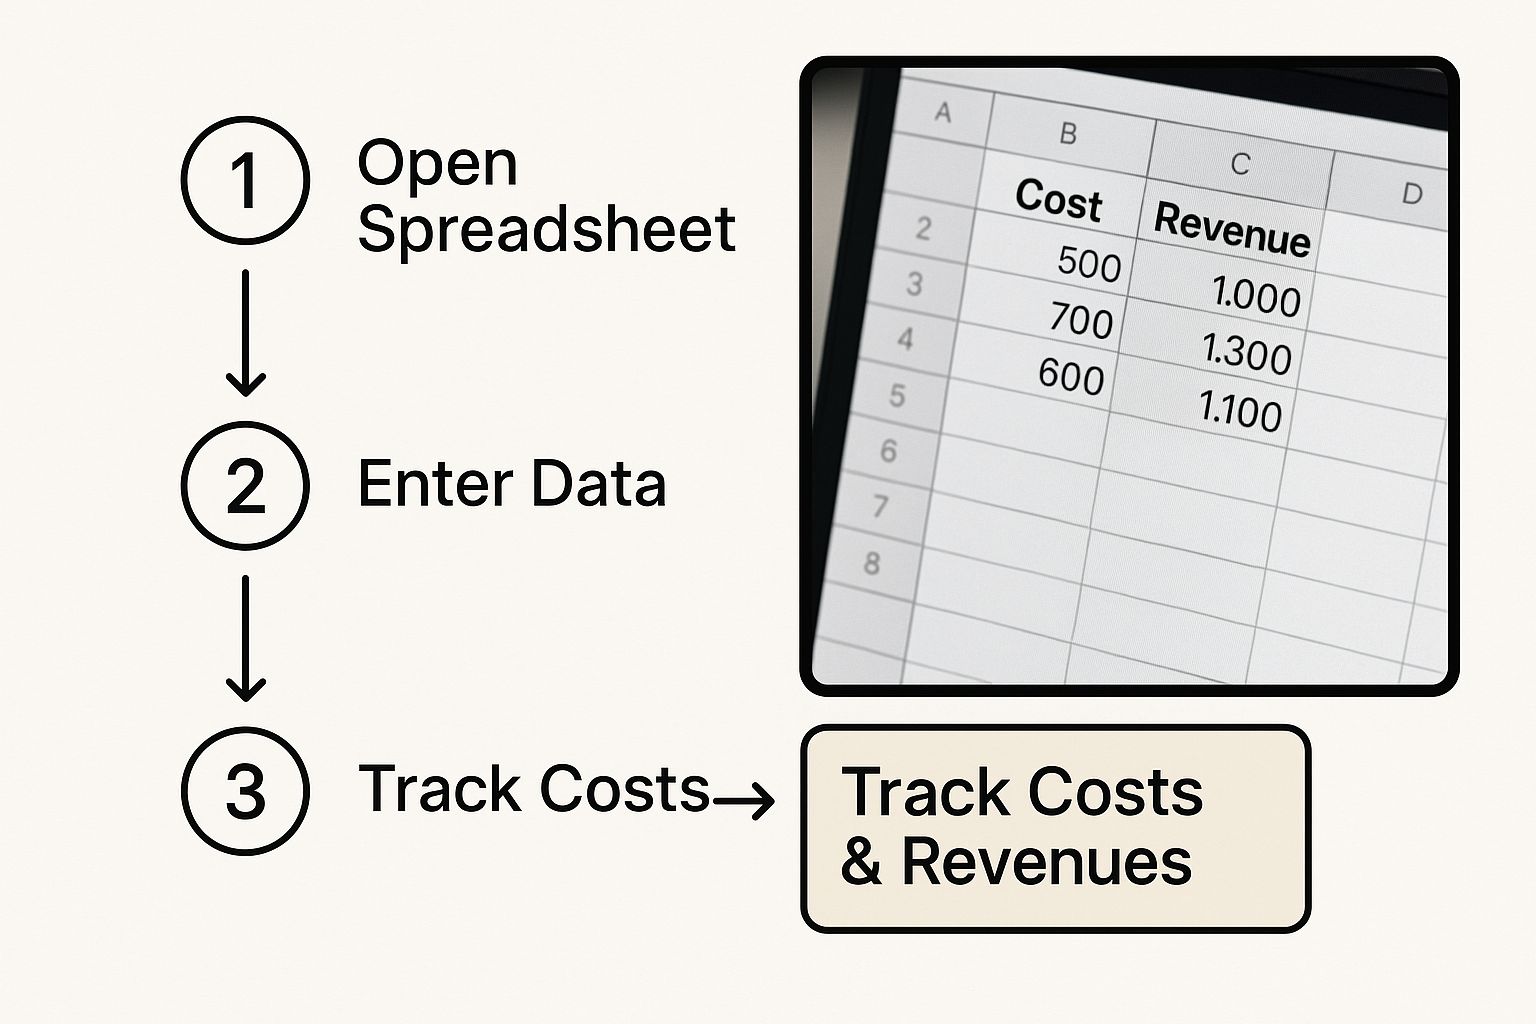
Visualizing your costs and revenues like this is the first step. It helps you understand the basic inputs you'll need, no matter which attribution model you choose.
The Classic Single-Touch Models
Single-touch models are simple but often tell a dangerously incomplete story. They give 100% of the credit to just one touchpoint.
First-Touch Attribution: Gives all credit to the very first interaction. Great for seeing what fills the top of your funnel.
Last-Touch Attribution: The polar opposite. Gives all credit to the final touchpoint before conversion. Handy for identifying your strongest "closers."
The problem? Most customer journeys aren't a straight line. Relying on these models is like crediting a championship win to either the first pass or the final goal, ignoring the team effort in between.
A Smarter Approach With Multi-Touch Models
Multi-touch attribution models get it. They know decisions rarely happen after one interaction. They spread credit across multiple touchpoints, giving you a more balanced view.
Each model tells a different story about what you value.
Linear Model
The most democratic model. It splits credit evenly across every touchpoint. Five interactions before a sale? Each gets 20% of the credit.
When to use it: Works well for shorter sales cycles or when you believe every interaction plays an equal role.
Time-Decay Model
Gives more credit to touchpoints closer to the sale. The ad they clicked yesterday gets more credit than the blog post they read a month ago.
When to use it: Perfect for short consideration phases, like a DTC brand running a limited-time sale.
Position-Based (U-Shaped) Model
A popular hybrid. Gives 40% of the credit to the first touch (discovery) and 40% to the last touch (closing). The remaining 20% is split among the interactions in the middle.
When to use it: A fantastic choice for businesses that value both lead generation and conversion. It respects both opening and closing the loop.
Pro Tip: Don't just pick one model and stick with it. Use your analytics platform to compare how different models change the ROI story. You might find your "low-performing" blog content is actually a first-touch hero that's been ignored for years.
Making the Right Choice for Your Business
Choosing an attribution model is not one-size-fits-all. It must align with your business model and sales cycle.
If you have a long B2B sales cycle, a single-touch model will give you a skewed picture. A recent Nielsen report warns that over-relying on a narrow set of channels can hurt returns. When you measure in silos, you miss the big picture. You need integrated systems that capture the impact of every touchpoint. Find more details in the full Nielsen report on maximizing ROI.
Here's a quick cheat sheet to get you started:
If Your Priority Is... | Your Sales Cycle Is... | A Good Starting Model Is... |
|---|---|---|
Generating new leads & awareness | Long and complex (B2B) | First-Touch or U-Shaped |
Driving immediate sales | Short and transactional | Last-Touch or Time-Decay |
Understanding the full journey | Medium length, multiple touchpoints | Linear or U-Shaped |
Ultimately, the best attribution model gives you the most actionable insights. It should help you answer the most critical question: "Where should I invest my next dollar to grow?"
The Tech Stack for Bulletproof ROI Tracking
You can't measure what you can't see. Calculating marketing ROI without the right tech is like navigating a maze blindfolded. To get numbers you can trust, you need a cohesive tech stack that provides a single source of truth.
This isn't about hoarding expensive software. It’s about building a smart, integrated data pipeline that follows a customer from first click to final sale.
Your Foundational Pillars
Every solid ROI tracking system is built on two non-negotiable platforms: web analytics and a Customer Relationship Management (CRM) system. These are the bedrock.
Your starting point is Google Analytics 4 (GA4). It's your window into what’s happening on your website—where traffic comes from, how people behave, and what actions they take. Setting up conversion goals here is step one.
A Customer Relationship Management (CRM) like HubSpot or Salesforce is where the magic happens. It turns anonymous visitors into actual leads and customers with names, deal stages, and real revenue attached.
Here’s the critical part: you must integrate GA4 and your CRM. This connection shows you that a lead didn't just come from a LinkedIn ad, but that this specific person became a $50,000 deal six months later. Without that link, your ROI puzzle is missing its most important piece.
Layering on Specialized Tools
Once your foundation is solid, layer in specialized tools. These fill measurement gaps that GA4 and a CRM can't solve alone, giving you a complete view.
Here are the essential additions:
Attribution Software: While GA4 has basic models, dedicated platforms like HockeyStack or Ruler Analytics offer far more sophisticated multi-touch attribution. They help you finally move past "last-click" thinking.
Call Tracking Platforms: What happens when a customer sees an ad and picks up the phone? That's a huge tracking black hole. Tools like CallRail or Invoca assign unique, trackable phone numbers to your campaigns, attributing calls back to the specific ad that drove them.
Data Visualization Tools: Pulling data from multiple platforms into a spreadsheet is a mess. A tool like Looker Studio or Tableau lets you build unified dashboards. You can show ad spend right next to influenced revenue, giving you an at-a-glance view of your real-time ROI.
Beyond tools, you need solid processes. Check out these practical steps for tracking marketing performance to ensure your data collection is robust. A tool is only as good as the process behind it.
Key Insight: A perfect tech stack isn’t about having the most tools. It’s about having the right tools integrated seamlessly to tell a single, coherent story.
Your tech stack should shatter data silos. When marketing, sales, and finance all look at the same numbers, you can stop debating data and start making decisive, profitable moves.
Turning Your ROI Data into Decisive Action
An ROI percentage on a dashboard is just a number. Lifeless. Its real power is in the decisions it forces you to make. This is where measurement becomes momentum.
Forget passively reporting on ROI. It’s time to use it as a weapon to shape your next move.

First, give that number context. A 300% ROI sounds amazing, but is it? You’ll never know without benchmarking it against industry standards and your own past results. This is how you find out if you're lagging, average, or absolutely crushing it.
Identifying Your Winners and Losers
With clear ROI data, you can finally stop guessing. You have the evidence to see which campaigns are burning cash and which ones are printing it. This is about ruthless prioritization based on financial return.
Your goal is a simple, powerful comparison. Look at your ROI channel by channel.
Email Marketing: Still a high-return workhorse, or is your list tired?
Paid Search: Are top ad groups still profitable after rising CPCs?
Content Marketing: Which articles actually influence your most valuable deals?
This clarity is your green light to reallocate your budget. If a channel is underperforming, fix it or—more decisively—cut its funding and double down on what’s working.
The point of measuring ROI is to make better decisions. Dig deeper into how you can transform raw numbers into strategic moves with this guide on turning data into actionable insights.
To make this process clearer, let's look at common benchmarks and the actions you can take.
Channel ROI Benchmarks and Optimization Actions
This table breaks down typical ROI benchmarks and gives you a clear "if this, then that" playbook for optimizing your spend.
Channel | Typical ROI Benchmark | If ROI is Below Benchmark... | If ROI is Above Benchmark... |
|---|---|---|---|
Email Marketing | 40:1 | Audit list health, A/B test subject lines, and review send frequency. Are you burning out subscribers? | Segment top performers and create targeted, high-value campaigns just for them. Scale what works. |
Paid Search (PPC) | 2:1 - 3:1 | Review negative keywords, refine ad copy to improve Quality Score, and check landing page conversion rates. | Increase the budget on winning campaigns. Explore expanding to related long-tail keywords. |
Content Marketing | 3:1 - 5:1 (long-term) | Promote existing high-performing content. Re-evaluate your topic strategy to target bottom-of-funnel keywords. | Identify the topics that resonate most. Double down by creating more "sequel" content on that theme. |
Social Media Ads | 2:1 - 4:1 | Test new creative and audiences. Is your ad format stale? Is your targeting too broad? Narrow your focus. | Scale ad spend cautiously while monitoring frequency. Reinvest profits into higher-quality creative. |
This breakdown turns a vague ROI number into a concrete to-do list, helping you systematically improve your marketing machine.
The Brand vs. Performance Tug-of-War
One of the toughest calls is balancing short-term performance marketing with long-term brand building. It's a classic tug-of-war.
Performance marketing (like paid search) gives you immediate, trackable ROI. Brand marketing (like top-of-funnel content) is harder to measure and pays off over a longer horizon.
It’s tempting to pour all your money into what’s easily measured. This is a trap. A business that only chases short-term performance will eventually see returns dry up. You need a steady stream of new people discovering your brand.
The data backs this up. Companies that use data-driven marketing report 5-8% higher marketing ROI. But over-investing in short-term ads can decrease ROI by 20-50%, while a balanced strategy can boost it by 25-100%.
A healthy strategy feeds both sides. Use ROI data to keep performance channels efficient, but fiercely protect the budget for long-term plays that build your brand and create future demand. This includes investing in strong educational content, a cornerstone of our recommended content marketing best practices.
Creating Your Actionable Feedback Loop
Your ROI data shouldn't be a report you glance at once a quarter. It needs to be the engine of a continuous feedback loop that powers your strategy. This is how you create a cycle of improvement.
Here’s a simple framework:
Measure: Consistently track ROI across key channels.
Analyze: Compare performance against benchmarks. Find the outliers—good and bad.
Hypothesize: Ask "why?" Why did one campaign crush another? Form a quick hypothesis.
Act: Make a decisive change. Reallocate budget, launch an A/B test, or pause a money-pit campaign.
Repeat: Measure the results and start the loop all over again.
This process transforms your team from campaign launchers into strategic operators. It builds a culture of accountability and ensures your marketing gets more profitable over time.
Your Questions on Marketing ROI Answered
Let's get real. Figuring out ROI in the wild is messy. It’s full of “what-if” scenarios that trip up even seasoned marketers.
Here, we cut through the theory and tackle the tough questions that pop up when you start trying to connect spend to dollars.
How Soon Should I Expect to See ROI From a New Campaign?
Honestly? It all comes down to your sales cycle. If your expectations don't match how your customers buy, you'll kill a brilliant strategy too early.
For an e-commerce brand using paid search, the path from click to checkout is short. You could see meaningful ROI data in a few weeks.
But a B2B software company using SEO and content is playing a different game. It could take 6-12 months to see a true return. That content needs time to rank, build authority, and influence a buying decision that might take three quarters to close.
Key Takeaway: Set ROI timelines based on your customer’s journey, not a generic quarterly calendar. Misaligned expectations are the #1 killer of great long-term marketing.
What if I Can't Tie Revenue Directly to an Activity?
This is the classic headache for top-of-funnel efforts like organic social, brand plays, or PR. When a straight line to a sale is impossible, get creative with proxy metrics and controlled tests.
Instead of hunting for direct revenue, look for a lift in related metrics that signal progress:
Branded Search Volume: Did more people Google your company's name after the campaign launched?
Direct Website Traffic: Are more people typing your URL straight into their browser?
High-Intent Actions: Assign a dollar value to actions like newsletter sign-ups or whitepaper downloads.
Another pro move is a controlled experiment. Crank up your organic social in a specific region but keep it the same everywhere else. Then measure the difference in sales lift between the two. This proves a strong correlation even when you can't prove direct causation.
What Is the Biggest Mistake Marketers Make Calculating ROI?
The most common—and most expensive—mistake is incomplete cost accounting. It’s too easy to just look at ad spend and call it a day. That creates a dangerously inflated ROI that makes you think you're crushing it when you might be losing money.
To get a true read, you must include all "soft costs":
Internal Team Salaries: The portion of your team's time spent on the campaign.
Agency & Freelancer Fees: The full invoice for outside help.
Software Subscriptions: The cost of your analytics tools, schedulers, and CRM.
Content Creation Expenses: Money spent on design, video, and copy.
Forgetting these costs leads to terrible strategic decisions. A campaign that looks like a 400% ROI home run could actually be in the red once you factor in all real costs.
Ready to stop guessing and start building a predictable growth engine? Viral Marketing Lab provides bootstrapped founders with the tools, templates, and proven frameworks to drive real results without breaking the bank. Access our entire suite of resources at https://viralmarketinglab.com and turn your marketing into a measurable profit center.


