What Is Engagement Rate And Why It Matters

Engagement rate is your content’s scoreboard. It measures the percentage of interactions versus reach or followers. Likes, comments, shares, clicks—all count. Track this metric to spot winners, ditch flops.
Quick Engagement Rate Overview
This single figure instantly shows content resonance:
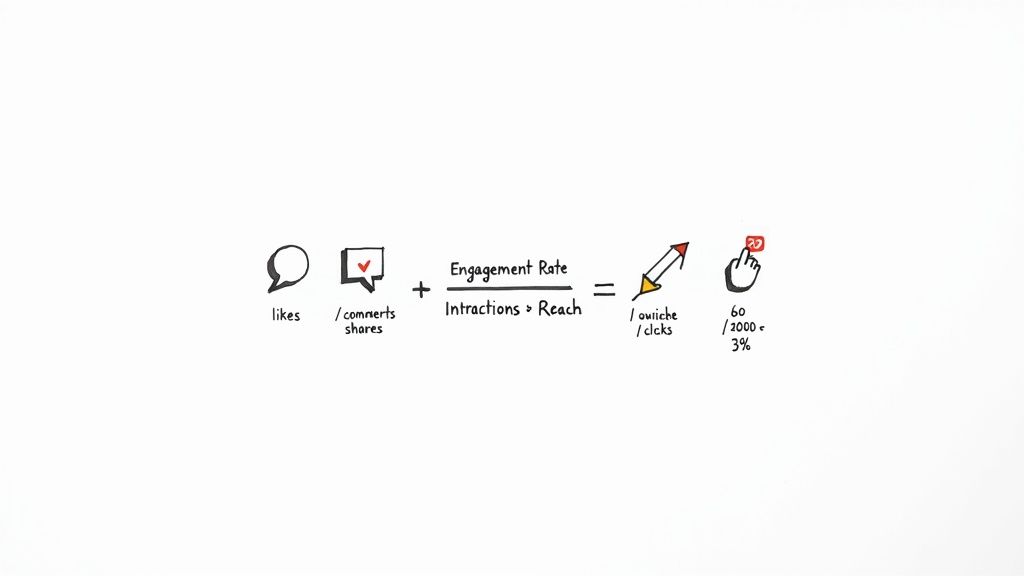
Interactions: Likes, comments, shares, clicks
Formula: (Total interactions ÷ Reach) × 100
Benchmarks: Instagram ~1–3%, Facebook ~0.5–1.5%, LinkedIn ~4–6%
To see why this simple metric matters so much in influencer marketing, check out why engagement rate matters most for influencers.
High engagement = deep resonance, not just broad reach.
Engagement Rate At A Glance
Metric | Definition | Example Value |
|---|---|---|
Interactions | Total actions on a post (likes, comments, etc.) | 250 |
Formula | (Interactions ÷ Reach) × 100 | 2.5% |
Benchmarks | Typical range by channel | IG: 1–3%, FB: 0.7% |
Next Steps
Tweak formulas for Instagram, Facebook, LinkedIn, TikTok
Compare your rates to industry standards and set clear targets
On Instagram, aim for 10–30 interactions per 1,000 followers (1–3%). On Facebook, target 5–15 actions per 1,000 reached (0.5–1.5%). LinkedIn’s 4–6% means 40–60 reactions per 1,000 impressions.
What’s Next
Keep reading for exact formulas, fresh benchmarks, and hands-on tips to boost your engagement rate.
Master Engagement Rate Basics
Think of engagement rate as the difference between a glance and a handshake. It flips raw likes into a fair %, so you can compare big brands and niche players side by side.
Reach vs Engagement: Invitations vs guests
Percentages: The true apples-to-apples metric
Resonance Check: High engagement signals strong content
Zero in on interactions, not just eyeballs. That focus saves time, energy, and budget.
Why Percentages Matter More
Chasing volume alone can mislead. A 2% LinkedIn rate on 5,000 impressions (100 interactions) beats 50 likes on 10,000 followers (0.5%). Always compare percentages, not totals.
Track rates over time to find real trends
Set percentage-based targets for consistency
Use benchmarks to highlight top formats
With these steps, you turn raw data into actionable intelligence. For global social media trends, check DreamGrow.
In 2025, 64% of the world will use social media. TikTok’s engagement sits at 4.86%, Facebook at 5.07%, LinkedIn at 6.50%, while Instagram dipped to 0.61%. Platform dynamics change fast—stay agile.
Common Misleading Comparisons
“Without the right context, a high interaction count can mask low audience investment.”
Line up reach and engagement side by side to see genuine impact.
Spotting Smart Metrics
Look for steady engagement growth, not one-off spikes
Compare formats: images, videos, carousels
Benchmark against industry averages for realistic goals
Dive deeper into crafting content that drives engagement: creating engaging content. Next: detailed calculations.
Calculate Engagement Rate On Major Platforms
Understand each platform’s interaction types and whether to use reach or follower count.
Instagram Engagement Calculation
Method:
Sum likes and comments (and saves if available).
Divide by total followers.
Multiply by 100.
Example: 5,000 followers; 120 likes, 30 comments, 10 saves = 160 interactions.
Engagement Rate = (160 ÷ 5,000) × 100 = 3.2%
Be consistent with your formula for fair comparison.
Facebook Engagement Calculation
Count reactions, comments, shares. Use reach for clearer insights.
Example: 50 likes + 10 comments = 60 interactions; reach = 5,000.
Engagement Rate = (60 ÷ 5,000) × 100 = 1.2%
LinkedIn Engagement Calculation
Include clicks, likes, comments, shares. Divide by impressions.
Example: 20 likes, 5 comments, 3 shares, 2 clicks = 30 interactions; 2,000 impressions.
Rate = (30 ÷ 2,000) × 100 = 1.5%
Clicks and shares on LinkedIn often signal real leads.
TikTok Engagement Calculation
Use likes, comments, shares vs views.
Example: 300 likes, 50 comments, 20 shares = 370 interactions; 10,000 views.
Rate = (370 ÷ 10,000) × 100 = 3.7%
In 2025, Instagram’s reach-based avg sits at 3.00%, above Facebook’s 1.20%. Instagram’s rate fell 12% YoY (3.50% vs 1.65%). Always weigh engagement alongside reach. Learn more: social media reach findings on SocialInsider.
Common Pitfalls To Avoid
Switching base metrics mid-report
Omitting high-value interactions like clicks
Comparing different time frames without normalization
Reporting Your Rates
Platform | Interactions | Base Metric | Engagement Rate |
|---|---|---|---|
Likes, Comments, Saves | Followers | 3.2% | |
Reactions, Comments, Shares | Reach | 1.2% | |
Clicks, Likes, Comments, Shares | Impressions | 1.5% | |
TikTok | Likes, Comments, Shares | Views | 3.7% |
Present clear tables. Align channels side by side and let real interaction guide your strategy.
Benchmark Engagement Rates By Industry
Industry benchmarks help you set realistic goals. Spot platform quirks and audience habits.
Government on LinkedIn: 2.7%
Retail on Instagram: 3.0%
Tech on LinkedIn: 3.6%, Instagram: 3.3%
Energy & Utilities on Instagram & Reels: 3.8%
Industry | Platform | Engagement Rate |
|---|---|---|
Government | 2.7% | |
Government | 3.5% | |
Government | Instagram Reels | 2.6% |
Consumer Goods | 3.0% | |
Technology | 3.6% | |
Technology | 3.3% | |
Energy & Utilities | Instagram & Reels | 3.8% |
Facebook & TikTok | Facebook, TikTok Combined | ~1.5% |
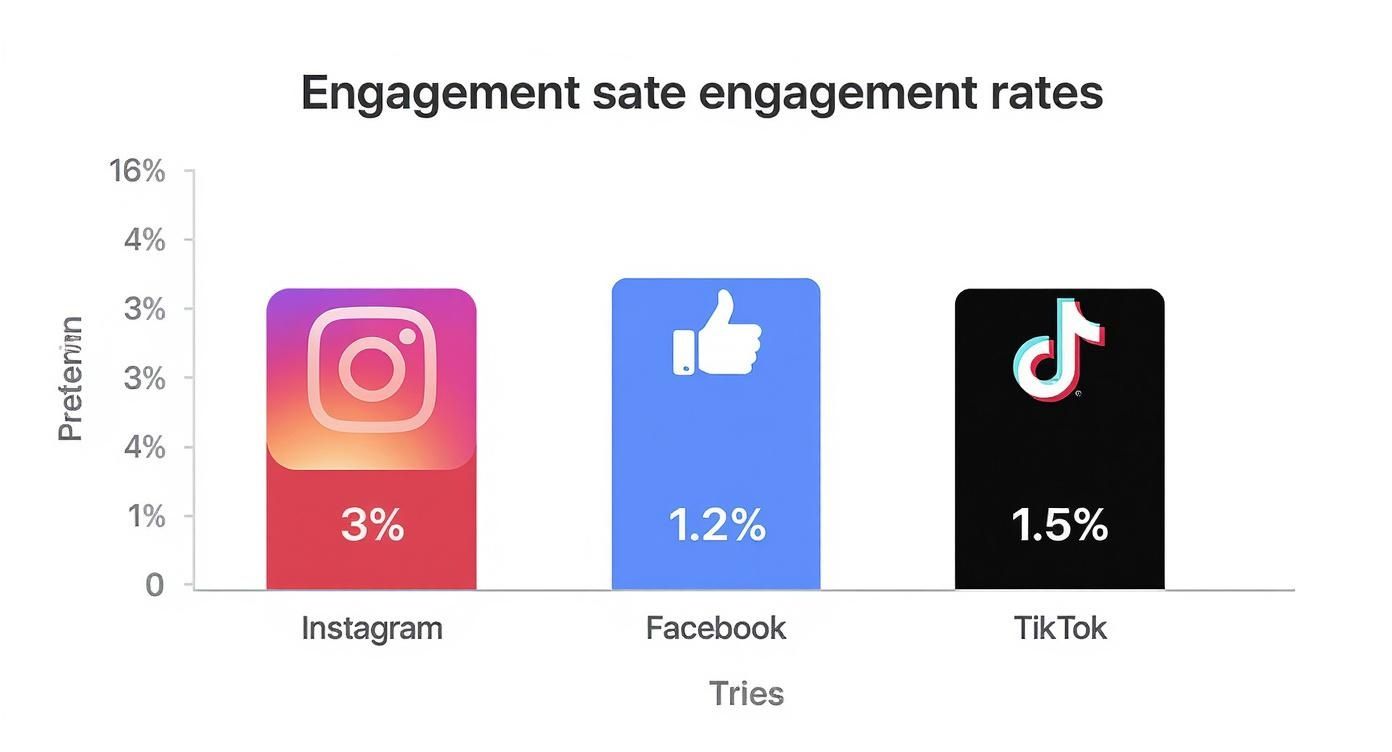
Instagram leads at 3%, TikTok at 1.5%, Facebook at 1.2%. Use these gaps to focus energy.
For more, see Average Engagement Rate Benchmarks.
Interpreting Benchmarks For Your Startup
Benchmarks shift with audience size, brand stage, and content mix.
Benchmarks become powerful when tailored to your audience.
Review sector averages monthly to track trends
Test formats driving clicks, comments, shares
Set incremental targets to build momentum
Applying Benchmarks To Your Strategy
Map your content themes to the closest industry category. Then aim to beat those averages by 10–20%.
Spot three high-performing competitor posts
Test two new formats weekly
Log weekly engagement in a shared dashboard
Case Study Snapshot
A fintech startup targeted energy sector’s 3.8% Instagram Reels benchmark and set a 4.2% goal. They used carousels and customer stories. In four weeks, LinkedIn engagement jumped 15%, click-throughs +5%.
Track Engagement Rate With Simple Tools
Monitor engagement daily without pricey subscriptions. Use Google Sheets or free SaaS apps to free up creativity.
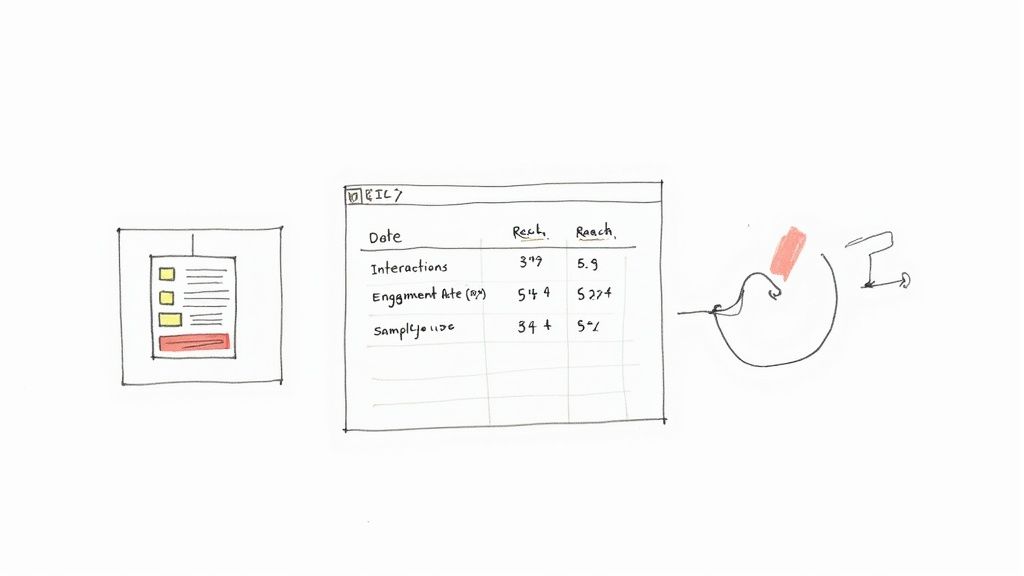
Set Up Google Sheets Reporting Template
Copy our Google Sheets template, paste raw data, and watch charts auto-populate. Macros or Apps Script generate weekly summaries.
Steps:
Copy and rename the template.
Paste raw data into the Data tab.
Review the Summary sheet every Monday.
Use Free Dashboards for Automated Reports
Metricool covers up to 5 profiles for free; Buffer tracks 3 channels. Both auto-fetch data every 15–60 minutes.
Link your accounts, pick a date range, and download charts.
Automated dashboards cut manual work by up to 80%.
Metrics To Include
Reach: Unique views per post
Click-Through Rate: Clicks ÷ impressions × 100
Engagement Rate: Interactions ÷ reach × 100
Automate Data Imports With API Or CSV
Generate API key in Metricool Settings.
Use Google Sheets API Connector add-on.
Schedule hourly imports for live data.
Pro Tip: Archive monthly raw data before overwrites.
Compare Tool Features
Tool | Cost | Key Features | Ideal Use |
|---|---|---|---|
Google Sheets | Free | Custom formulas, charts, macros | DIY reports |
Metricool | Free up to 5 profiles | Scheduling, analytics, CSV export | Multi-profile tracking |
Buffer | Free up to 3 channels | Simple stats, post planner, RSS feed | Content scheduling |
Zapier | Free tier | Automations, webhooks, multi-apps | Workflow integration |
Track Mobile Engagement
Metricool mobile shows live charts for Instagram and Twitter
Buffer app alerts dips in engagement rate
Google Sheets mobile retains macros and charts
Generate Weekly PDF Reports
Export from Buffer or Metricool
Sync PDFs to Google Drive
Share via Slack or email
Team Collaboration Tips
Grant view/edit access in Sheets; use comments
Use @mentions in Buffer’s team inbox for anomalies
Tag reports with project names for easy search
Integrate Social Scheduling Workflow
Plan posts in Buffer or Metricool based on top engagement windows. For more, see Free Social Media Scheduling Tools.
Visualize Trends With Charts
Use line charts to spot daily swings. Apply heatmap formatting to see peak hours at a glance.
Set Alerts For Anomalies
Configure Metricool to email you if weekly engagement drops by 10%.
Maintain Data Hygiene
Monthly, purge old projects and test data. A clean sheet equals clear insights.
Boost Your Engagement Rate With Proven Strategies
Stop posting and praying. Lean on tactics proven to push double-digit gains in weeks.
For Twitter-specific moves, check strategies to boost your Twitter engagement rate.
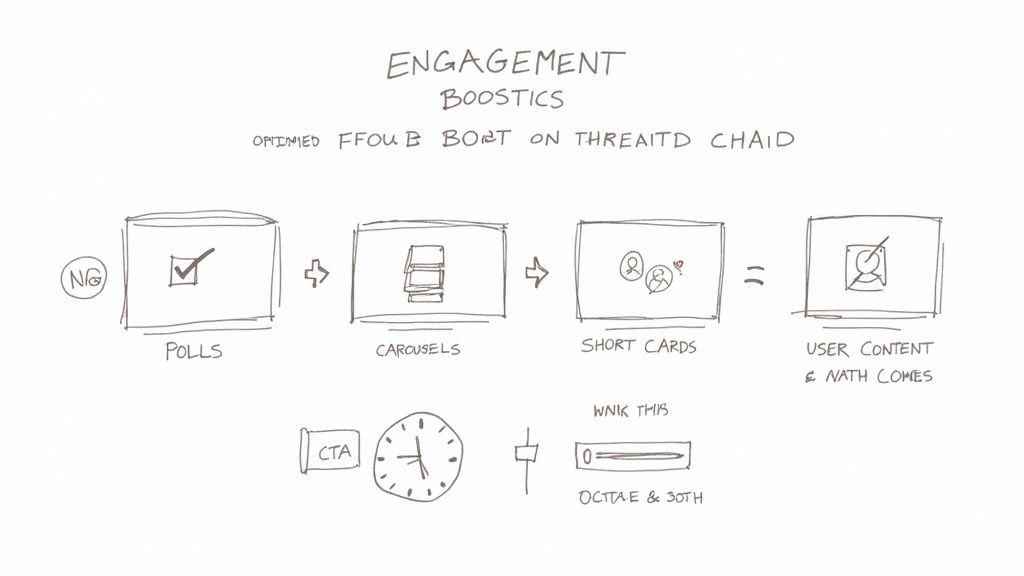
Interactive Format Tactics
Polls on Stories: Tap into 73% of users craving two-way fun
Carousels: Drive 30% more swipes with step-by-step guides
Short Videos: Hook viewers in the first 3 seconds
Timing Windows: Post at peak times for a 2X lift in early reactions
Case Study: Weekly Instagram polls drove engagement from 4.1% to 7.2% in three weeks.
Craft Compelling Calls To Action
CTAs guide action. Keep them sharp and reward-driven.
“Tap to see the result”
“Comment your opinion”
“Save this for later”
A strong CTA bridges curiosity and action.
Adding consistent CTAs can boost click-throughs by 15%.
Leverage User Generated Content
UGC builds trust. Invite users to share with your hashtag and spotlight the best.
Encourage everyday product photos
Offer shoutouts or rewards
Create a UGC Story Highlight
One DIY tool maker saw UGC engagement soar from 3.8% to 5.5%.
Design Community Challenges
Host weeklong photo challenges with daily prompts.
Define a theme each day
Share a demo post
Ask participants to tag friends
Highlight top entries
A fashion startup attracted 120 user posts and lifted engagement by 12%.
Learn more: Check out our guide
Monitor And Iterate Quickly
Track tactics in Google Sheets or free dashboards. Compare week-over-week:
Tactic | Before Engagement | After Engagement |
|---|---|---|
Instagram Polls | 4.1% | 7.2% |
Carousel Posts | 3.0% | 3.9% |
User Generated Content | 3.8% | 5.5% |
Hashtag Challenges | 6.5% | 7.3% |
Double down on winners. Drop underperformers.
Continuous Learning And Adjusting
Stay flexible. Review data and share insights.
A/B test CTAs and visuals
Rotate content types weekly
Hold monthly brainstorms
Set clear, metric-driven goals
Apply these tactics now. Ignite conversations, gather feedback, and watch your startup thrive with meaningful engagement.
Engagement Rate FAQ
Got questions about engagement rate? This FAQ clears platform quirks and action steps.
Which interactions count?
Likes, comments, shares, clicks, saves (where available)
How to compare platforms?
Pick one denominator—reach or followers—and stick with it.
“Engagement rate is your content’s performance compass.”
Comparing 1.2% on Facebook to 5% on Instagram Story shows where to double down.
Common Engagement Rate Questions
Question | Quick Tip |
|---|---|
Reach vs. Followers | Choose one metric and stay consistent |
Which interactions to include | Likes, comments, shares, clicks, saves |
Spotting real change | Track month-over-month shifts |
Pair engagement with click-through and conversion rates to align strategy with behavior. Review benchmarks monthly. Engagement rate maxes out at 100%—interactions ÷ reach.
Ready to sharpen your social strategy? Visit Viral Marketing Lab for templates and tools built for bootstrapped startups.


